
Exploring data and using it to add value to your business has become really important in the last few years. Data exploration has become a key task for information workers and business analysts.
SAP Analytics Cloud is a solution that has made this mundane task simpler and less time-consuming for information workers and business analysts.
This blog article will be about how SAP Analytics Cloud has made data analysis more simple and what new features have been added to make your data exploration tasks more efficient.
Before talking about features, let’s just have a quick look at what SAP Analytics Cloud is?
The future success of operations largely depends on innovative technologies like blockchain, augmented reality, and artificial intelligence, alongside traditional alternatives like cloud, analytics, and mobility.
Since the internal IT department typically handles application management, many business owners are generally confused with the importance of SAP AMS. Therefore, keeping the same in mind, this blog closely examines how the potent SAP Support adds to your operations.
Let’s learn more about this in detail in our blog.
What is SAP Analytics Cloud?
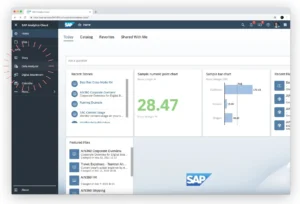
SAP Analytics Cloud is one of the tools of SAP portfolios that meet the need for data visualization in the Cloud. It is basically a SaaS (Software as a Service) Business Intelligence (BI) platform designed by SAP. It was specially developed to provide all analysis functions in one product for all users. SAP Analytics Cloud has become one of the solutions which have empowered data analysts and business decision-makers to visualize, plan, and make predictions in a secure Cloud-based environment.
According to SAP, this is different from other BI platforms, which often have to integrate data from different sources. Users have to switch between different applications when performing tasks such as generating reports. According to SAP Analytics Cloud, users can work more efficiently with all data sources and analytics capabilities in one product. The most important functions are accessed through the same user interface, which is easy for business users.
Next, let’s look at some important features of SAP Analytics Cloud.
Application management services encompass various offerings, including managed cloud (also known as hybrid landscape management), complete application outsourcing, and SAP support on-demand.
This can also involve optimization (advisory services, roadmaps, evaluations), application improvements, incident management, change management (roll-outs, change requests, upgrades), and other related activities.
A quality SAP Application Management Services offering include its fundamental component. These end-to-end services are provided by certified consultants who use their business expertise and SAP experience to provide your company with the most value possible.
Time to value is shortened since they do this frequently and have teams of specialists throughout the SAP environment. You may use your SAP solution more strategically when the AMS provider acts as an extension of your company.
This indicates that AMS engages in more than just “lights on.” Let’s discuss the many advantages that AMS offers your company.
Single synchronized Data Exploration Experience
This feature of SAP Analytics Cloud enables data analyzers to become the central point for data exploration. SAP’s vision is to combine the SAC Explorer and Search for Insights functions into the Data Analyzer in the long term.
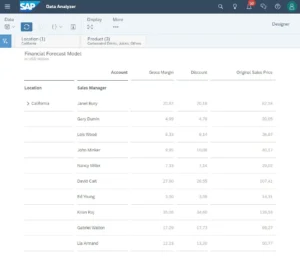
If you are someone who works on data information, be it, controller or analyst, you are going to love the new Data Analyzer module. With Data Analyzer, you can answer specific business questions quickly and independently. Data analysis is now available for the executives based on hypotheses of business or insights finding / trends or getting a structured overview of the company’s financial performance across different dimensions.
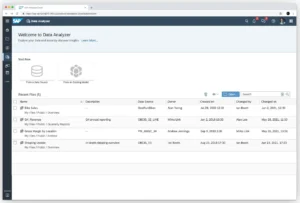
With the release of a new version of Q4, the side navigation bar in SAP Analytics Cloud is now accessible for data analyzer that contains a new home page.
With this above-mentioned home page, the information worker can effectively start a new data exploration from scratch.
Data Analyzer can connect directly to BW BEx queries and HANA calculation views without creating a SAC model. Data Analyzer can also connect to an existing SAC model (live or purchased model). Data Analyzer enables ad hoc analysis of a data source, and the result of the analysis can be saved as an “Insight.” A perspective consists of a name, a table display, and a context (data source, navigation state, filter settings, variable values). Display as a graphic is planned for future releases.
Information can be shared between individuals and teams. Unlike the Explorer view, insights are completely independent of stories. They can be accessed directly from the “My Files” folder (File Repository) and opened directly or via a URL.
What’s new about my Explorer?
Numbers of customers have SAC stories where Story Explorer is enabled with one or more widgets. Usually, the end-user logs into Explorer, create their own “exploration view,” and saves it via history bookmarks.
Story Explorer will not be supported in optimized view mode but will continue to be available in non-optimized view mode in the future. SAP is currently looking to provide an easy transition from an exploratory view to an insight-based Data Analyzer.
For now, customers can save two versions of the same story and share it with end-users:
- Disabled optimized view mode story version
- Enabled optimized view mode story version
Now, what’s the next SAP going to add?
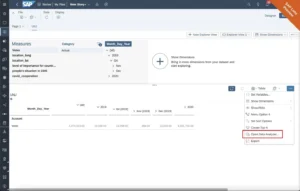
SAP has some cool features in its roadmap for Data Analyzer in Q1 2022. The first is being able to open Data Analyzer from a story in table views. The state of the table is passed to the data analyzer (such as filters, variables, and current drill-through actions) for further investigation. The first version is supported in non-optimized mode.
![]()
Statistics are stored in the file repository and are only listed as recently used files on the home page. In the future, users will be able to publish information in the catalog and add metadata to it. This makes it easy to search for findings on the catalog by using search and filter functions.
In addition to these new features, we also continue to improve access to live BW connectivity:
Configuration of the text presentation (short, medium, long and extra-long)
SAP BW query conditions are enabled in table visualization user variants saver.
To help customers with their transition, SAP is working on a smooth path to the Data Analyzer from the table widget of an Explorer view (later also from the diagram as soon as the Data Analyzer supports the display of the diagram)
Conclusion
With the advancement in technology, it has become important for organizations to look towards the technology, which eventually helps them grow as an organization. SAP Analytics Cloud is a technology that supports you and makes you more agile towards your business processes. Its fast data analytics capabilities provide you with seamless analysis to make better decisions.

30+ years of experience managing large, complex SAP programs across industries, geographies, and functions. Expert in enterprise-scale transformation and program governance.
Explore related blogs
-

What’s new in the SAP Analytics Cloud release for Q3 2021?
Everyone is eyeing towards the latest technology or an upgrade that makes their processing and personalization fast and flawless. Let's checkout new releases for SAC in Q3 2021.
Read more -
Maximize performance with the capabilities of SAP Analytics Cloud
Pre-loaded with lots of beyond our imagination capabilities SAP Analytics cloud has recently launched with a new updated version of SAP Analytics cloud (2021.14 – Q3 QRC). Visit us to know more!
Read more -
Discover Actionable Business Insights Data with SAP Analytics Cloud
SAP Analytics Cloud brings together all the analytical capabilities of SAP, such as planning, BI, predictive analytics, ML, and other digital tools under a single cloud-based solution. Visit us to know more!
Read more -
How does SAP Analytics Cloud empower businesses?
Interested in learning about what SAP Analytics Cloud can do for businesses? Let’s walk through the ways SAP Analytics Cloud can help businesses make better decisions.
Read more


